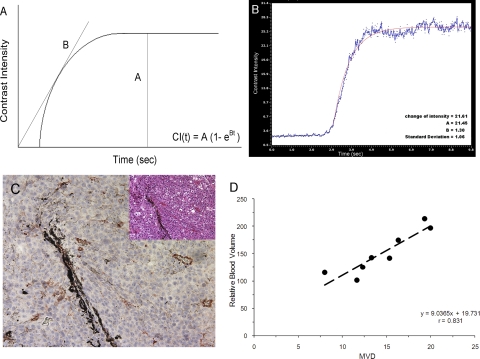
Figure 6.
(A) Schematic depiction of the method used to assess tissue perfusion with contrast ultrasound. On the y-axis is peak intensity as a measure of microbubble contrast retention in an ROI. On the x-axis is the replenishment time. Straight lines: nonlinear square fitting of the video intensities with time, which can be depicted with the exponential equation CI(t) = A(1 − e−Bt). In this equation, the A value is calculated as the difference in peak intensity between the baseline and steady state, and the B value is derived from the slope of an exponential curve. (B) Example of a smoothed time-intensity curve shows enhancement in the ROI. (C) Representative immunohistochemical analysis of endothelial cell density, assessed with an anti-vWF antibody at ×200 magnification (inset, hematoxylin and eosin, original magnification, ×200). (D) Scatter plots show the positive relationship between relative blood volume and MVD measured by vWF staining.

