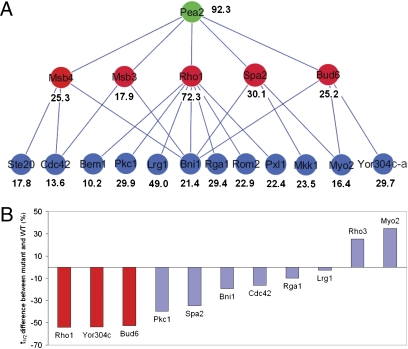
Fig. 4.
Effects of the scaffold protein Pea2 on the dynamics of its interacting proteins. (A) Local hierarchical organization of protein dynamics descending from Pea2 (green). It can be observed that proteins (red) more closely interacting with Pea2, generally exhibit longer t1/2s than those (blue) further away from Pea2 in the hierarchy (the only exception is Yor304c-a). Shown are those components for which residence times were determined by iFRAP analysis. (B) Effects of pea2Δ on the dynamics of a subset of proteins in the hierarchy depicted in A examined by iFRAP. Shown are % changes of t1/2 in pea2Δ compared with those in the WT. Red bars represent proteins in the higher hierarchy that directly interact with Pea2, and blue bars represent those in the lower hierarchy shown in A.

