Fig. 5.
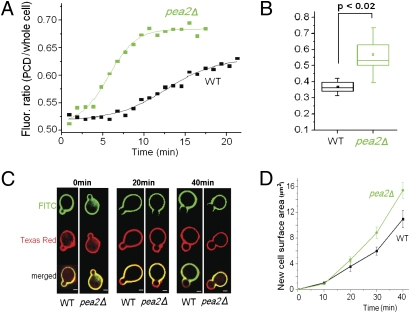
Effects of Pea2 on polarization kinetics and the rate of polarized growth. (A) Observation of GFP-Rho1 polarization in WT (black) and pea2Δ cells (green) by time-lapse movies (Movies S4 and S5). The plots show representative time-dependent changes in the average fluorescence intensity of GFP-Rho1 in the PCD, normalized against the average intensity in the whole cell. (B) Quantification of the rates of Rho1 polarization in time-lapse movies as described in A. The polarization rate was defined as the slope at the inflection point of the sigmoid curve used for fitting. Statistical representation is the same as described in Fig. 2D. (C) Example cell images for cell wall growth during budding in WT and pea2Δ cells by fluorescent Con A staining. Regions staining only with Texas Red Con A but not FITC Con A (red-only zones in merged images) represent a recent area of cell wall growth. (Scale bar: 2 μm.) (D) Quantification of cell wall growth during budding in WT and pea2Δ cells by fluorescent Con A staining. Plots show the increase in the area of growth over time. Averages of measurements from 15 to 25 cells per time point per strain are shown. Error bars reflect SEM.

