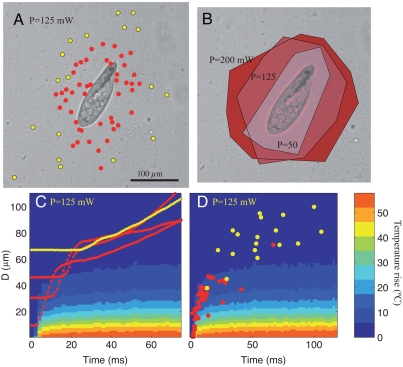
Fig. 3.
(A) Type of response to the laser heating as a function of position. Laser power in this image is P = 125 mW. In all parts, red points indicate trichocyst escape and yellow dots indicate purely ciliary escape. (B) The minimum distance to trigger trichocyst escape increases as the laser power increases. The three shaded areas correspond to three different laser powers. (C) Color shadings indicate the temperature as a function of time and distance from the laser focus. The red curves show the minimum distance between the cell and the laser focus during trichocyst escape, while the yellow curve shows ciliary escape. Note that these curves display a clear shift in regime from a stationary state to an escape pattern. (D) The moment at which the escape is triggered as a function of the minimum distance from the laser.

