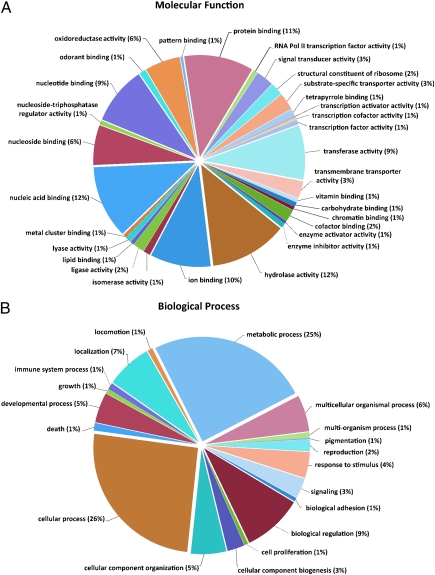
Fig. 1.
GO analyses of Manduca antennal transcriptome data. GO analysis of Manduca sequences corresponding to 7,131 contigs, as predicted for their involvement in molecular functions (A) and biological processes (B), is shown. Data are presented as level 3 GO categorization for molecular function and level 2 GO categorization for biological process. Classified gene objects are depicted as percentages (in brackets) of the total number of gene objects with GO assignments.

