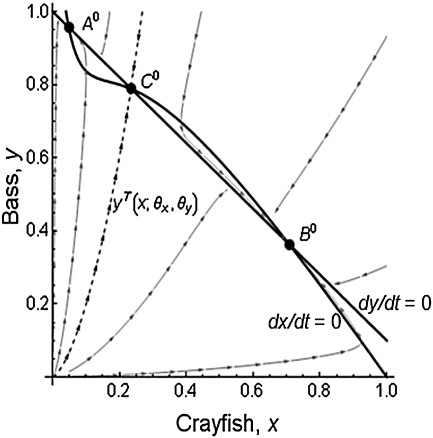
Fig. 3.
Multistability in the decoupled system. The dx/dt = 0 and dy/dt = 0 curves are the nullclines for the decoupled system, with points A0, B0, and C0 representing the equilibrium points. Points A0 (non-outbreak) and B0 (outbreak) are locally stable, whereas C0 is unstable. The dashed line, yT(x; θx, θy) is the threshold between basins of attraction. Arrows represent sample trajectories.

