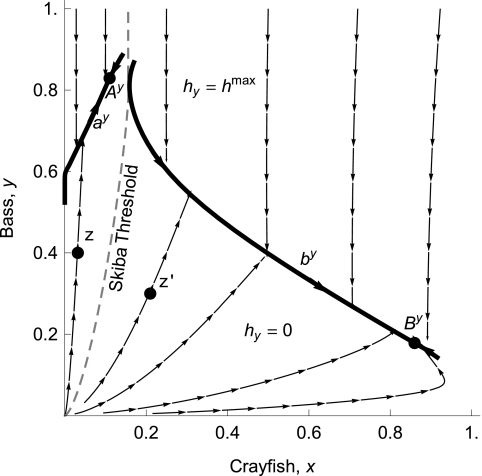
Fig. 5.
Managing bass but not crayfish. This feedback control diagram represents optimal bass harvest levels for different combinations of x and y (given hx = 0). There are two locally stable equilibria, Ay (non-outbreak) and By (outbreak). The “Skiba threshold” divides the state space into two basins of attraction. Along the curves ay and by (including the endpoint equilibria Ay and By), bass harvests are applied at their singular values (SI Text S2). Above these curves, bass harvests are applied at their maximum value. Below these curves, bass harvests are zero. Arrows represent sample trajectories. Trajectories for initial points to the left of the threshold, such as point z, move to path ay and then to equilibrium Ay. Trajectories for initial points to the right of the threshold, such as point z′, move to path by and then to equilibrium By.

