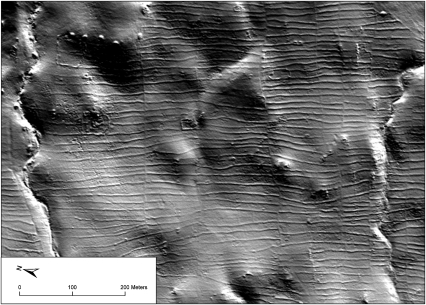
Fig. 2.
LiDAR image of the Kaiholena–Makeanehu study area (see Fig. 6) showing crosscutting pattern of field alignments (running roughly north–south) and trail boundary segments (running roughly east–west). Several individual household enclosures are also visible. See Fig. 6 for a map of the same area. Image courtesy of Greg Asner.

