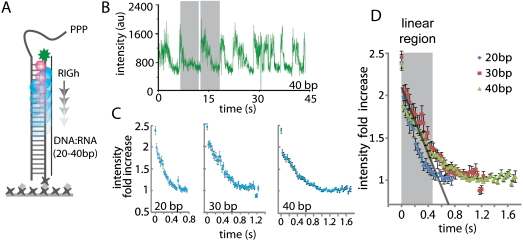
Fig. 2.
RIGh-induced PIFE effect. (A) Schematic of RIGh translocation on RNA∶DNA heteroduplex. (B) A single molecule trace of RIGh translocation. (C) Overlay of about 50 single-molecule traces from 20, 30, and 40 duplex. (D) Overlay of averaged translocation events from all three duplexes. The shaded region represents the PIFE-sensitive range at which translocation signals are most linear.

