Fig. 3.
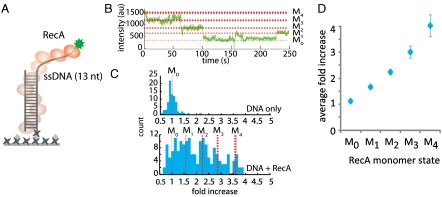
RecA mediated PIFE effect on ssDNA. (A) Schematic of RecA monomers forming a filament on single-strand DNA. (B) A representative single-molecule trace displaying RecA monomer binding and dissociation. PIFE levels correspond to M0 to M4 states. (C) Intensity histograms from the clustering analysis show a narrow single peak for DNA only (top) and appearance of distinct peaks corresponding to M0 to M4 states when RecA is added (bottom). (D) Plot of the average fold increase obtained from five independent measurements.

