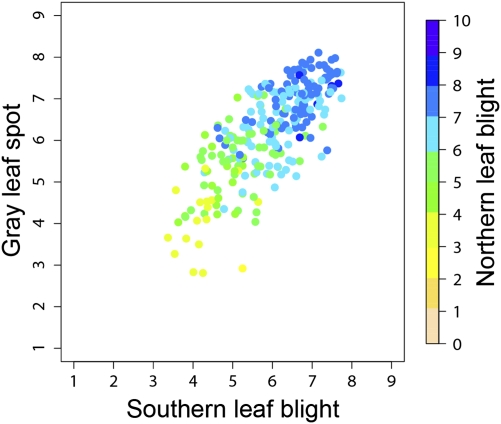
Fig. 1.
Scatterplot of breeding values for resistance to SLB, GLS, and NLB. Each point corresponds to a different inbred line; breeding value-based inbred line ranks are available in Table S4. Axes span the full range of the measurement scales (for NLB, the transformed scale) for which resistance increases with increasing values. A color scale is used to indicate breeding values for NLB resistance.

