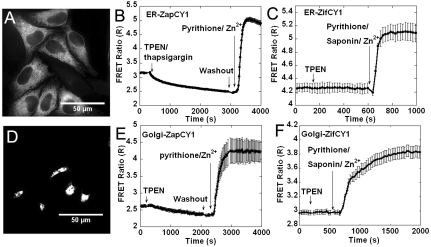
Fig. 2.
Targeting Zn2+ sensors to ER and Golgi in HeLa cells. (A) Fluorescence image of ER-ZapCY1. (B) Representative traces (n = 6 cells) for ER-ZapCY1. The FRET ratio decreased with 150 μM TPEN/10 μM thapsigargin and increased with addition of 5 μM pyrithione and 10 nM Zn2+. (C) Representative traces (n = 6 cells) for ER-ZifCY1. The FRET ratio did not change with TPEN but increased with 25 μM pyrithione, 0.001 mg/mL saponin, and 500 μM Zn2+. (D) Fluorescence image of Golgi-ZapCY1. (E) Representative traces (n = 4 cells) for Golgi-ZapCY1. The FRET ratio decreased with 150 μM TPEN and increased with addition of 5 μM pyrithione and 10 nM Zn2+. (F) Representative traces for Golgi-ZifCY2 (n = 7 cells). The FRET ratio did not change with TPEN but increased with addition of 25 μM pyrithione, 0.001 mg/mL saponin, and 500 μM Zn2+.

