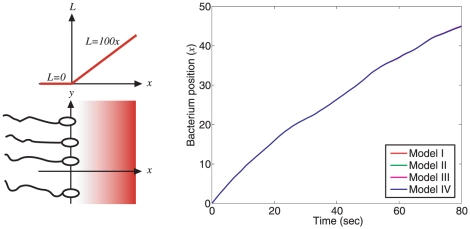
Figure 6. Comparison of chemotactic performance.
The four chemotaxis models are simulated in a two-dimensional environment, wherein the chemoattractant concentration L has a ramp profile that varies along the x-direction only, such that L = 100x for x>0 and L = 0 otherwise (left). The simulation output (right) shows the relative average distance travelled up the attractant gradient by ten cells for each of the chemotaxis models.

