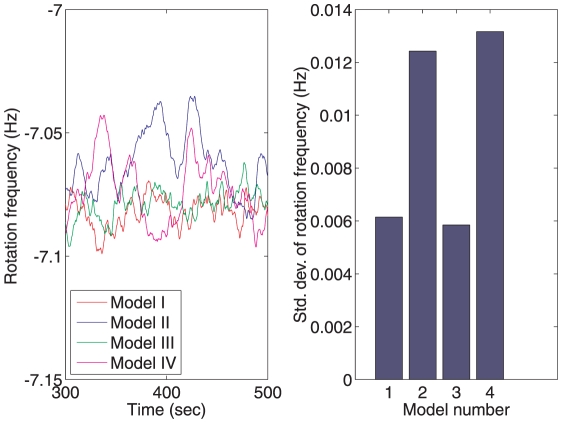
Figure 7. Response to external ligand variations.
Standard deviations of the flagellar rotation frequencies for each of the four chemotaxis models in response to a noisy ligand input sensed at the polar cluster given by L = max(0,1+η) (where η is a white noise signal with a zero-mean, unity variance Gaussian distribution).

