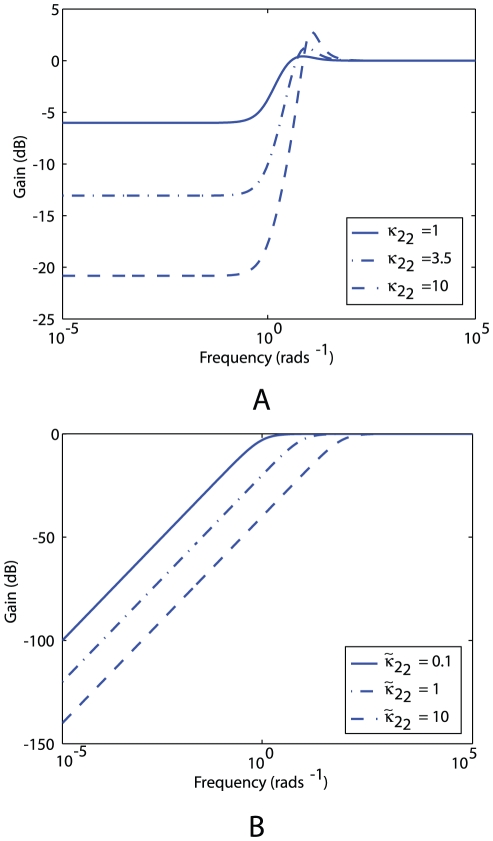
Figure 11. Variation of linear system sensitivity under different feedback strengths as a function of frequency.
(A) Bode magnitude plots of the sensitivity function of system (1) with  and different values of gain
  , which corresponds to the feedback strength of CheB2-P de-methylating active polar cluster receptors. With these gains the system is structurally similar to Model III. (B) Sensitivity function of the block corresponding to the cytoplasmic cluster in the linear model (1), for different values of feedback gain
  , which corresponds to the feedback strength of CheB2-P de-methylating active cytoplasmic cluster receptors. The frequency domain sensitivity function is
  (see Text S1).

