Figure 5.
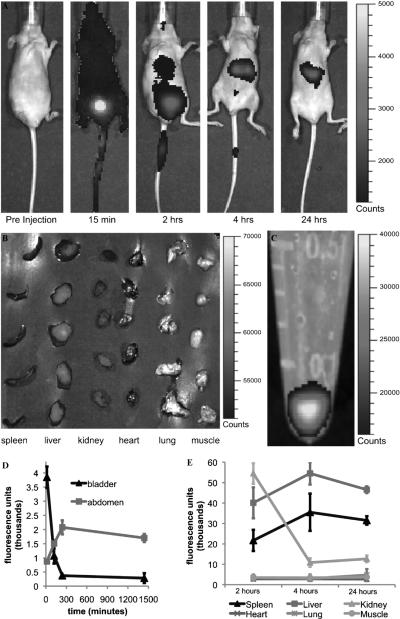
In vivo NIR imaging following intravenous administration of S1MPs tagged with Dylight 750. A, Representative pictures of mice injected with S1MPs and followed for 24 hours in a whole-animal imaging study (time points on the bottom of each image, n = 5). B, Organs collected after sacrificing the animal for ICP analysis (time point 2 hours). C, An NIR image of the vial containing the suspension of particles injected per animal. The scale bars on the right of the images apply to all images of the series. The settings were not changed during acquisition and analysis. D, Quantification of the fluorescence in the abdomen (spleen, liver, and kidneys) and in the bladder. E, Postmortem evaluation of the accumulation of the fluorescence signal in the different organs and tissues.

