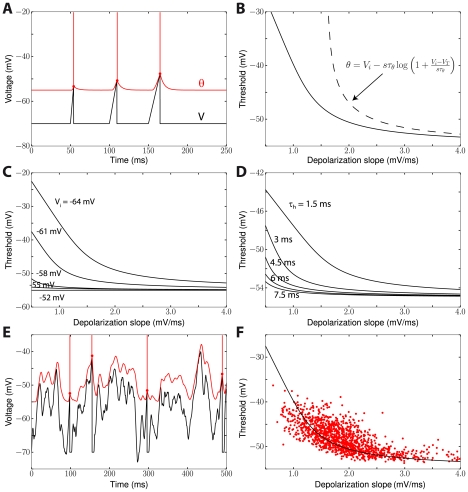
Figure 5. Slope-threshold relationship in the adaptive threshold model.
A, The neuron is linearly depolarized with a given slope s (V(t) = EL+st) until the membrane potential (black) reaches threshold (red) and the neuron spikes. The intersection of the black and red traces (red dots) can be calculated (see Results). B, Threshold vs. depolarization slope (solid line) and analytical formula when ka = ki (dashed line). C, Slope-threshold relationship for different values of the half-inactivation voltage Vi (Vi = −63 mV in panels A,B). D, Slope-threshold relationship for different values of the inactivation time constant ( in panels A,B). E, The iLIF model is driven by a fluctuating current and we measure the slope of depolarization before each spike over a duration
  by linear regression. F, Slope-threshold relationship measured with linear regression in the noise-driven iLIF model (red dots), superimposed on the calculated relationship from panel B.

