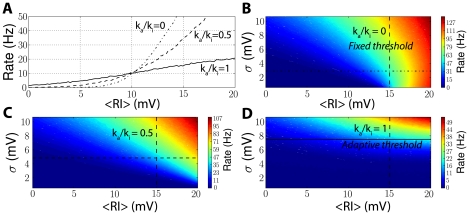
Figure 7. Firing rate as a function of input statistics.
An iLIF model was simulated in the same way as in Figure 6, but with different values for the parameter ka/ki, which controls threshold adaptation. A, Output firing rate vs. mean input with threshold adaptation (solid line, ka/ki = 1), with mild threshold adaptation (dashed line, ka/ki = 0.5) and without threshold adaptation (mixed line, ka/ki = 0). The horizontal axis is the input resistance R times the mean input <I>, i.e., the mean depolarization in the absence of spikes. The input standard deviation was chosen so that the neuron fires at 10 Hz when the mean depolarization is 10 mV. B, Firing rate (color-coded) vs. mean and standard deviation of the input, without adaptation (ka/ki = 0). The standard deviation is shown in voltage units to represent the standard deviation of the membrane potential in the absence of spikes, i.e.,  , where σI is the input standard deviation (in current units) and
  is the input time constant. The horizontal mixed line corresponds to the mixed line shown in panel A, and the vertical dashed line corresponds to the threshold for constant currents. C, Same as B, but with mild threshold adaptation (ka/ki = 0.5). D, Same as B, but with normal threshold adaptation (ka/ki = 1).

