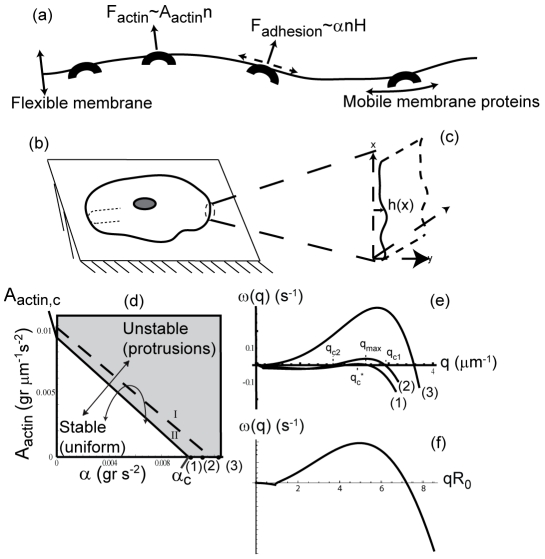
Figure 1. Model scheme and linear stability diagram.
(a) Schematic description of the model ingredients: a one dimensional flexible membrane contour, with convex and mobile membrane proteins, which induce normal protrusive forces, due to actin ( ) and due to adhesion-driven tension reduction (dashed arrows,
  ). Both forces are linearly proportion to the local membrane protein concentration
  , which in our coarse-grained model is treated as a uniform field on length-scales larger than those of the individual proteins. The one-dimensional membrane contour geometries that we calculate (b) round geometry representing the outer contour of a spread cell on a flat substrate, and (c) the flat geometry which describes either a segment of the cell contour or a membrane with translational symmetry. The variable
  gives the local height deformation of the membrane, relative to its uniform configuration. The curvature at the rim along the cell thickness is indicated by the thin dotted line in (b), and is not considered in our two-dimensional analysis. (d) The phase diagram obtained from the linear stability analysis as a function of the actin protrusive force (
 ) and adhesive strength (
 ). We find two regimes: Stable (uniform) state (below the solid line), and unstable above (gray region, for
  or
or  ). In the unstable regime we find type
  dispersion relation above the dashed line, and type
  dispersion relation between the solid and dashed lines. The correlation between the actin polymerization and the adhesion strengths is illustrated by two possible trajectories (lines with arrows) in this phase space. (e) The dispersion relations for three different values of
  (numbered and marked by bold dots along the
  axis in (c)). Negative values of the dispersion corresponds to stable modes, and positive values corresponds to unstable modes. (f) An example of the dispersion relation for the round cell; only the values at integer
  play a role. The real part (solid line) is zero at
  which is an asymmetric mode of translation, while it can be unstable for higher modes.

