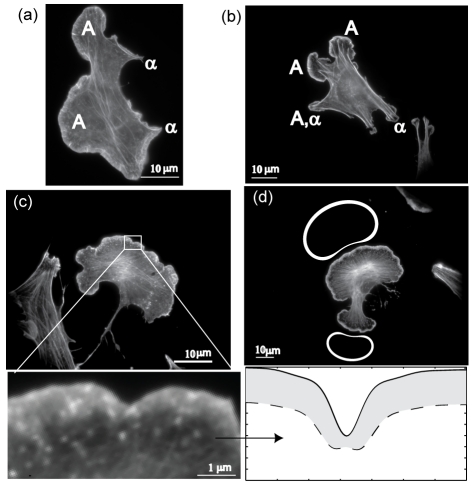
Figure 5. Qualitative comparison between observed and calculated cell shapes.
(a,b) Shapes of adhering cells on a flat two-dimensional surface, with fluorescently labeled actin. We denote lamellipodia by “A” and adhesion domains by “ ”. (c) A cell dominated by lamellipodia, where we show a segment of the cell perimeter (lower panel) and compare to the calculated (flat geometry) membrane shape (solid line) and cortical actin density (dashed line), assuming a constant rate of actin depolymerization behind the leading edge. (d) Comparison between cell shapes dominated by lamellipodia and the calculated cell shape and cortical actin density (round geometry).

