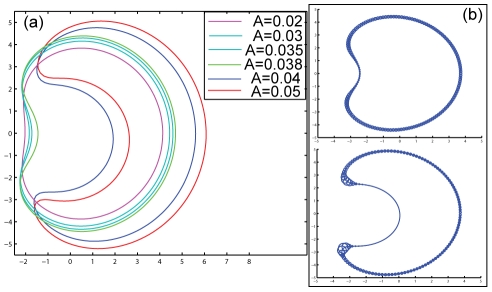
Figure 6. Crescent-cell shape transition at high actin polymerization levels.
(a) Calculated steady-state shapes of cells driven by actin polymerization (no adhesion,  ), for increasing levels of actin polymerization force parameter:
  (the non-linear tension parameter was taken to be
  ). The crescent shapes obtained above a threshold level of actin polymerization are similar to those observed in [34]. (b) Plot of the density distribution of the membrane proteins along the membrane for the two cases of
  (top and bottom respectively), to demonstrate the strong depletion in the dip region that accompanies the formation of the crescent cell shape. The size of the circles that decorate the cell contour are proportional to the local concentration of the membrane proteins.

