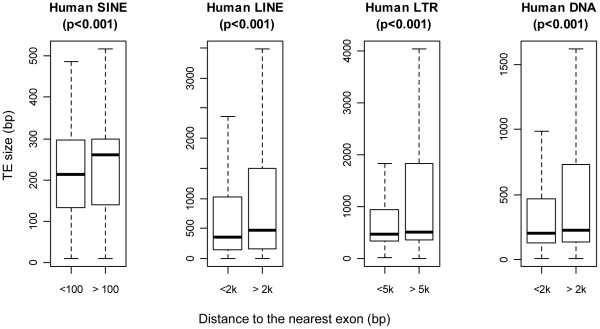
Figure 2. Average size of human TEs within and outside the U-zone.
Each TE class is divided into two groups as shown on the x-axis: one group for elements located within the corresponding U-zone of full-length TEs and another group for those beyond. The average size of each TE group is indicated as the horizontal bar within each box, which represents the central 50% of data points of the group. Outliers beyond the 1.5× IQR (interquartile range) whiskers are not shown. P-values shown on top of each boxplot are based on the two-sample Wilcoxon test.

