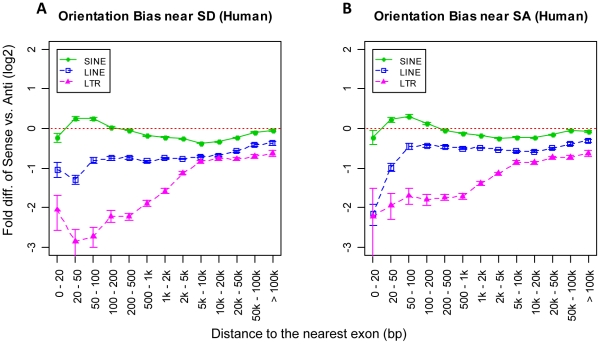
Figure 4. Orientation bias of human full-length intronic TEs based on their proximity to different types of splice sites.
Orientation bias of full-length TEs near SD sites (A) and SA sites (B). The x-axis shows a series of predefined intronic regions based on the distance from a TE to the nearest exon. The y-axis shows the logarithmic fold-difference of TE frequency between sense and antisense oriented TEs. Error bars are standard errors derived from the total number of corresponding TEs (sample size) in each bin.

