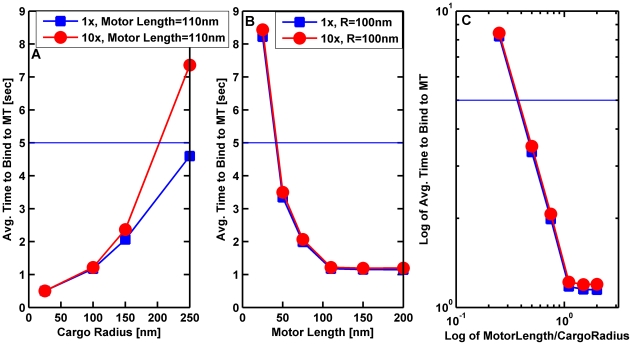
Figure 5. Average time for a cargo with a single motor to bind to a microtubule as a function of cargo radius and motor length.
(A) Average time for a 110 nm motor to bind to a microtubule versus cargo radius. (B) Average time for a motor bound to a cargo with radius 100 nm to bind to a microtubule as a function of motor length. (C) Log-log plot of the average time to bind (in seconds) versus the ratio of motor length to the cargo radius. The solid horizontal line marks a time to bind of 5 seconds. The cargo was initially resting on the MT with the motor randomly placed on the cargo's surface. The cargo was allowed to rotate randomly due to thermal effects, but it could not diffuse away from the microtubule. The simulations were run long enough to allow at least 95% of the cargos to bind to the microtubules. The binding time was the averaged over the cargos that bound to the microtubule in this time. The solid lines are guides to the eye. In all 3 plots the blue squares correspond to the viscosity of water (1×), and the red circles correspond to 10 times the viscosity of water.

