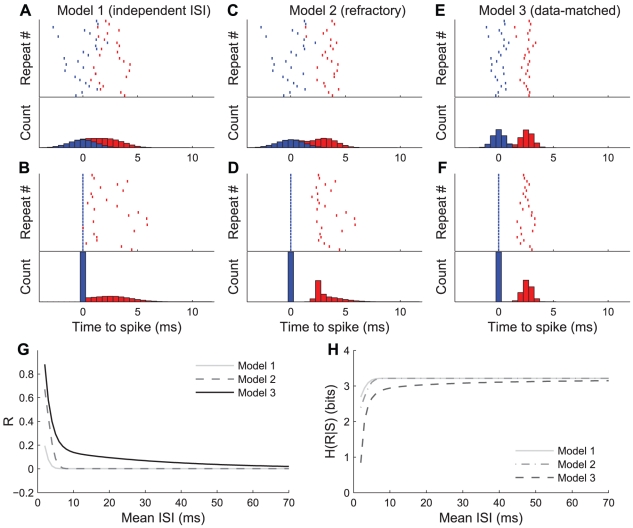
Figure 3. Three models of spike-spike interactions in doublet patterns.
A, Upper trace: raster plot of response from cell model 1 (independent ISI) to repeated presentations of a stimulus which reliably elicits a doublet with mean ISI of 2.6 ms, plotting convention as in Figure 2A. Both the first (blue) and second (red) spikes in the doublet are drawn independently from normal distributions with means of 0 and 2.6 ms, respectively, and standard deviations of 1.3 ms. A, Lower trace: Standard PSTH of raster from upper trace, convention conserved from Figure 2. B, Upper and lower traces: raster plot and PSTH showing same data from A with each row aligned to the time of occurrence of the first spike in the response, as in Figure 2B. C and D: (data presentation as in A and B) Model 2 of doublet behavior enforcing a relative refractory period between nearby spikes, using recovery function from Figure 1C and jitter SD of 1.3 ms. E and F: Model 3 (data-matched) of doublet behavior, where the relative timing of spikes is determined by Eqs. 1 and 2. G: Correlation coefficient between timing of first and second spikes of doublets drawn from the three models as a function of ISI. Note that the correlation of Model 3 matches the exponential model from Figure 2F by design. H: Conditional entropy (Eq. 4) of response pattern as a function of mean ISI for all three models.

