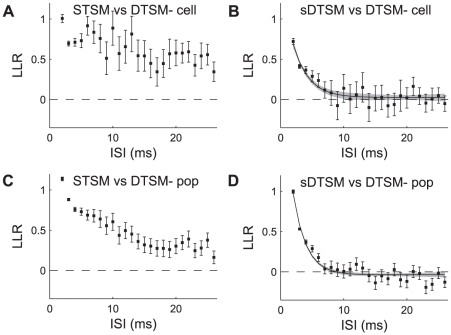
Figure 7. Likelihood analysis.
A: Distribution of mean log-likelihood ratios for data-based doublet and singlet models for ISIs ranging from 2–25 ms, from the same cell as in Figure 6. Error bars show ±95% confidence intervals on the mean. B: Distribution of log-likelihood ratios for data-based and synthetic doublet models for same cell as in panel A. Solid black curve shows double exponential model (Eq. 9) fit to data, gray shading indicates 95% confidence interval on predictions from model. C: Distribution of log-likelihood ratios for data-based doublet and singlet models, data pooled across 8 cells, presentation as in A. D: Distribution of log-likelihood ratios for data-based and synthetic models, pooled across 8 cells, as well as exponential model fit to data. Presentation as in panel B.

