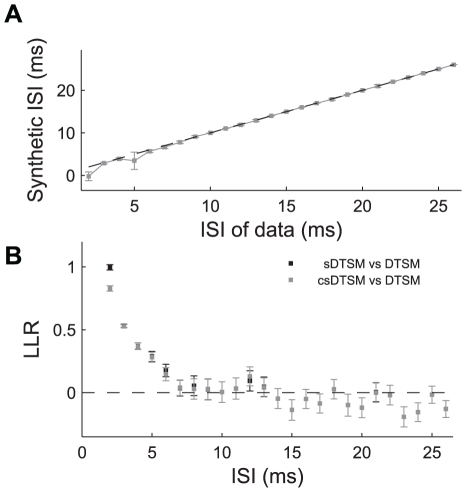
Figure 8. Non-linear compression.
A: Non-linear mapping between input ISI (x axis) and best-match synthetic ISI (y axis), determined from peaks in likelihood. B: Effects of non-linear compression on estimates of log-likelihood ratios. Black points show LLR between synthetic (‘synth mod 1’) and data-based doublet models, as in 7D, gray points show LLR between synthetic model modified by non-linear compression (‘synth mod 2’) and data-based doublet models.

