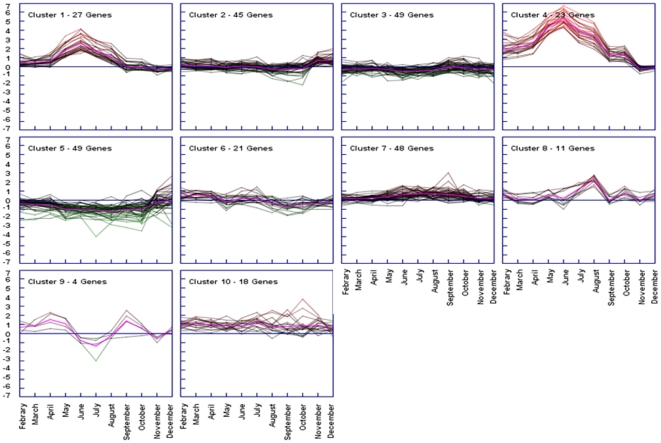
Figure 3. Decomposition of gene expression profile.
The k-means algorithm was used for the computation of different gene expression trends in the set of 295 unique genes whose expression was modulated in female digestive gland across the annual cycle (Fig 2 and Dataset S1). K-means is an iterative procedure aimed to reduce the variance to a minimum within each cluster [55], [56]. A tendency curve (centroid) is also depicted (pink solid line). In further analysis, genes included in clusters 1 and 4 were considered together as the two groups differed only for the intensity of relative mRNA abundance. Supporting information to Figure 3 is present on Dataset S2.

