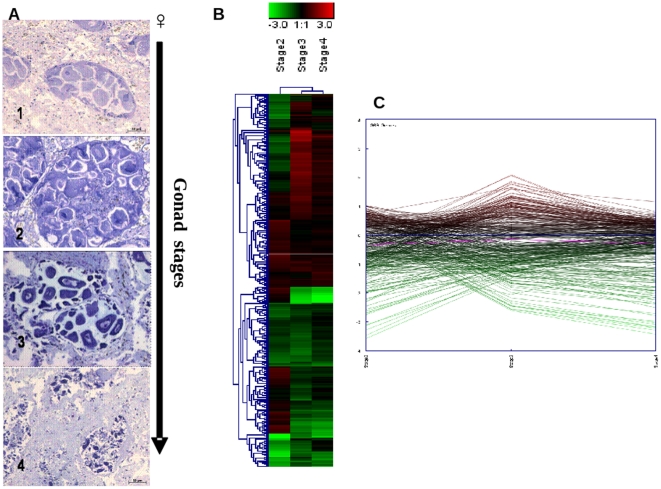
Figure 4. mRNA abundance patterns across female gonad maturation in mantles.
Shown are representative images of the reproductive stage of female gonad (1: Early stage-November 2007, 2: Development -January 2008, 3: Ripe -February 2008, and 4: Spawning -March 2008) determined according to [46], the heat map (B) (Pearson correlation, complete linkage algorithm) and the expression view plot (C) obtained for each stage vs the reference condition (stage I). 369 differentially expressed genes in at least one condition were considered for the analysis. Supporting information to Figure 4 is present in Dataset S4.

