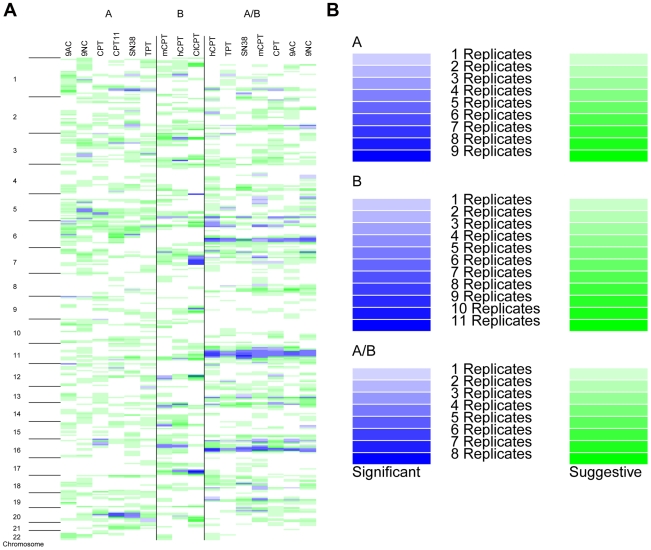
Figure 3. Genome wide pattern of QTLs for the camptothecins.
A. Group A contains camptothecin analogues used in primary screen. Camptothecin analogues in Group B were used in the validation screen. Camptothecins in Group A/B were rerun from the primary and secondary screens. Each chromosome was partitioned into 10 cM regions. B. Each drug-dose combination that resulted in a significant QTL (LOD>threshold value) is indicated in blue. Intensity of the shading indicates the number of doses replicating that QTL at either the suggestive or significant level. Regions which also had a suggestive QTL (LOD>suggestive threshold) are indicated in green with color intensity referring to the number of doses replicating this peak.

