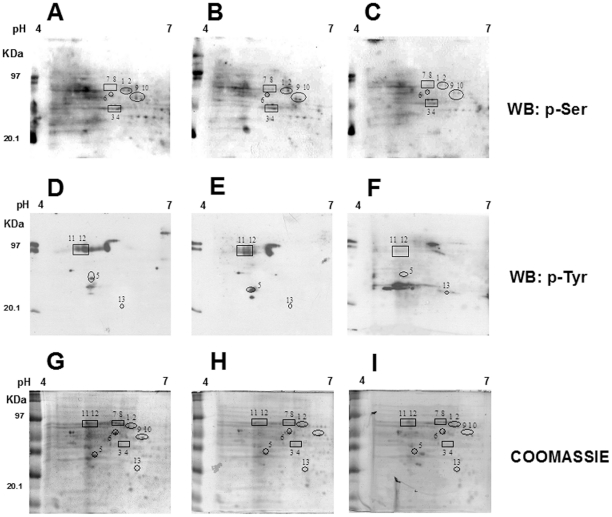
Figure 4. Phosphoproteome analysis of NB cell line treated or not with ATRA.
Representative 2-DE western blot (of three independent experiments) with anti-phosphoserine (A, B, C) and anti-phosphotyrosine (D, E, F) antibodies are shown. Proteins were separated using 7-cm, pH-4–7 strips followed by SDSPAGE on 10%, 8×7-cm gels. (A, D) SJ-N-KP control cells. (B, E) SJ-N-KP cells treated with 10 µM ATRA for 30′. (C, F) SJ-N-KP cells treated with 10 µM ATRA for 60′. The black squares and circles give the position of identified protein spots that are differentially phosphorylated in ATRA treated cells in comparison to control cells. The spot numbers correspond to the spot numbers listed in Table 3. Panels G, H and I show the representative (of three independent experiments) coomassie-stained 2-DE patterns of NB cell line SJ-N-KP not treated (G) and treated with ATRA for 30 minutes (H) and for 60 minutes (I). 2-DE was performed as described above.

