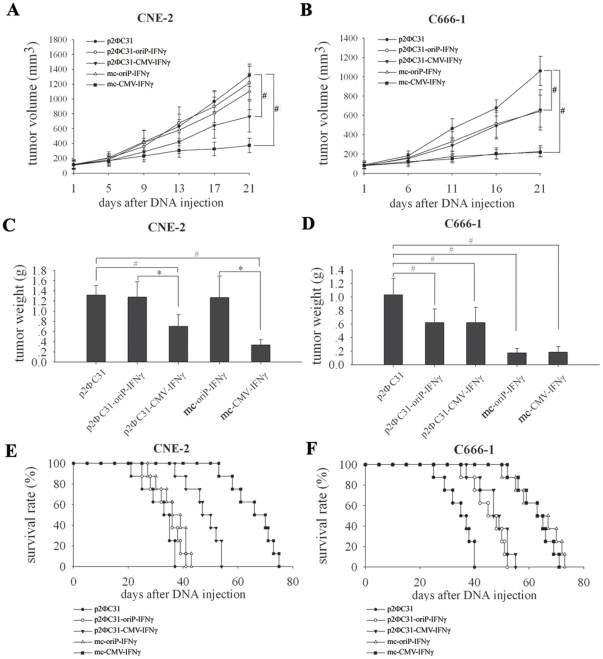
Figure 5. Selective antitumor effects of mc-oriP-IFNγ on the growth of NPC xenografts and survival analysis.
(A, B) Time-dependent evolution of tumor volume in mice inoculated with the CNE-2 and C666-1 cell lines (n = 6, each group). For CNE-2 cell-xenografted mice, mc-oriP-IFNγ or p2ΦC31-oriP-IFNγ versus p2ΦC31, p>0.05; mc-CMV-IFNγ versus p2ΦC31, p<0.05 at days 9, 13, 17, and 21; p2ΦC31-CMV-IFNγ versus p2ΦC31, p<0.05 at days 13, 17, and 21. For C666-1 cell-xenografted mice, mc-oriP-IFNγ versus p2ΦC31, p<0.05 at days 11, 16, and 21; mc-CMV-IFNγ versus p2ΦC31, p<0.05 at days 11, 16, and 21; p2ΦC31-oriP-IFNγ versus p2ΦC31, p<0.05 at days 16, and 21; p2ΦC31-CMV-IFNγ versus p2ΦC31, p<0.05 at days 16 and 21; mc-oriP-IFNγ versus mc-CMV-IFNγ, p>0.05. (C, D) Specific antitumor effects of mc-oriP-IFNγ on C666-1 cell-xenografted nude mice (n = 6, each group). Mice were sacrificed after three weeks of treatment, and tumors were resected and weighted. Columns, mean of six mice; bars, SD; #, p<0.05, compared with p2ФC31-treated group; *, p<0.05, gene expression under the control of oriP promoter compared with CMV promoter. (E, F) Effect of mc-oriP-IFNγ on survival (n = 8). For CNE-2 cell-xenografted mice, mc-oriP-IFNγ versus p2ΦC31, p = 0.066; mc-CMV-IFNγ versus p2ΦC31, p<0.0001. For C666-1 cell-xenografted mice, mc-oriP-IFNγ versus p2ΦC31, p<0.0001; mc-oriP-IFNγ versus mc-CMV-IFNγ, p = 0.368 (Kaplan-Meier).

