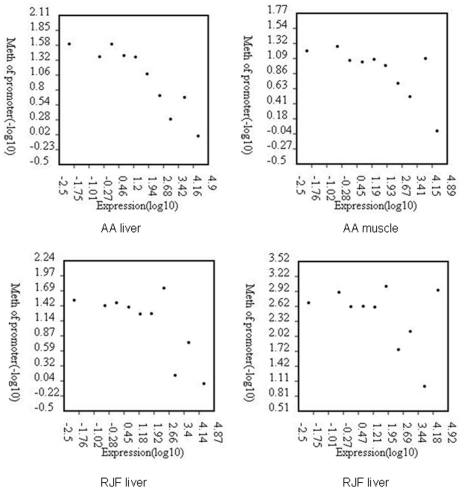
Figure 3. Relationship between promoter DNA methylation and gene expression level in chicken.
Genes were divided into 10 intervals according to expression levels. DNA methylation level was measured by the log ratio of the p value of the methylation peaks, with each point representing the mean expression level and the relative methylation level.

