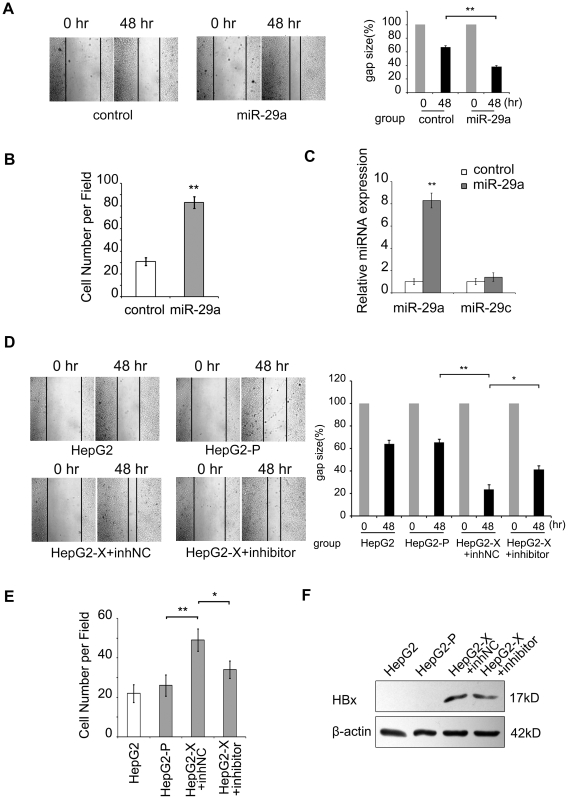
Figure 2. MiR-29a increases the migration of hepatoma cells.
(A) A wound healing assay was performed on HepG2 cells (1×10⁶, 6-cm plate) transfected with either an empty vector (control) or a miR-29a expression vector (3 µg). One representative experiment is shown. Black arrows indicate the wound edge. The residual gap between the migrating cells from the opposing wound edge is expressed as a percentage of the initial scraped area. (B) Modified Boyden's chamber assays showed that the cell migration was promoted by the miR-29a in HepG2 cells. A histogram shows the relative cell number of five randomly selected fields. (C) The expression levels of miR-29a and miR-29c were examined by qRT-PCR after overexpression of miR-29a in HepG2 cells. (D) A wound healing assay was performed on HepG2, HepG2-P and HepG2-X cells transfected with a miR-29a inhibitor (100 nM) or inhibitor negative control (inhNC). One representative experiment is shown. Black arrows indicate the wound edge. The residual gap between the migrating cells from the opposing wound edge is expressed as a percentage of the initial scraped area. (E) Modified Boyden's chamber assays showed that the cell migration was blocked by miR-29a inhibitor in HepG2-X cells. A histogram shows the relative cell number of five randomly selected fields. (F) Western blot analysis showed that the expression of HBx protein was not affected by the treatment with miR-29a inhibitor in HepG2-X cells. Statistically significant differences are indicated: *P<.05, **P<.01, Student's t test.

