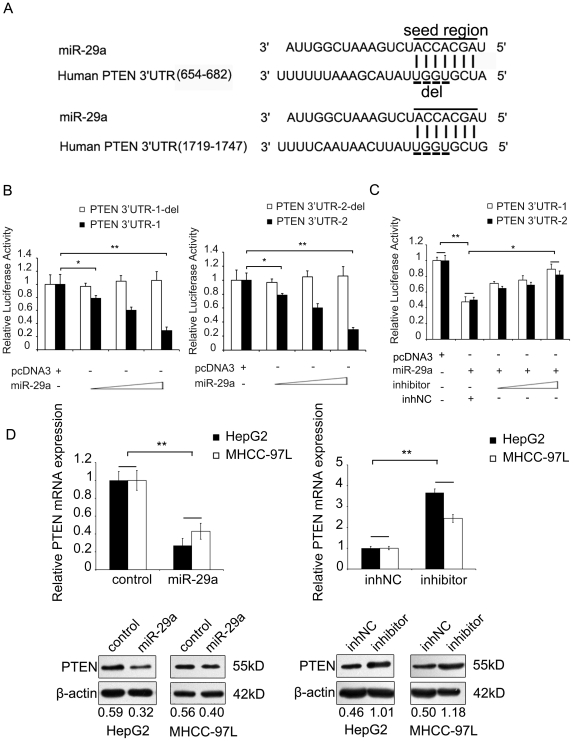
Figure 3. MiR-29a targets PTEN.
(A) Sequence alignment between miR-29a and the 3′UTR of human PTEN mRNA. Solid line, seed match region; dashed line, seed-deleted region. (B) Luciferase reporter gene assay showed the effect of miR-29a on the activity of PTEN 3′UTR reporter. Co-transfection was performed using the plasmids, such as human PTEN 3′UTR (PTEN 3′UTR-1 or PTEN 3′UTR-2) or the miR-29a-binding site-deleted (del) PTEN 3′UTR (PTEN 3′UTR-1-del or PTEN 3′UTR-2-del), a miR-29a expression plasmid (50, 100, and 200 ng), in HepG2 cells. Empty pcDNA3.0 plasmid (200 ng) was used as a negative control. (C) Luciferase reporter gene assay showed that the decreased luciferase activities of PTEN 3′UTR reporter (PTEN 3′UTR-1 or PTEN 3′UTR-2) in HepG2 cells mediated by miR-29a overexpression (200 ng) was rescued by a miR-29a inhibitor in a dose dependent manner (30, 50, and 100 nM). (D) Immunoblot and qRT-PCR showed that miR-29a (3 µg, 6-cm plate) induced a decrease in endogenous human PTEN protein and mRNA in HepG2 and MHCC-97L cells, which was increased by transfection with a miR-29a inhibitor. GAPDH and β-actin were used as internal controls. Protein bands were quantified using Quantity One software (Bio-Rad). The value under each lane indicates the relative expression level of the PTEN, which is represented by the intensity ratio between PTEN and β-actin bands in each lane. Statistically significant differences are indicated: *P<.05, **P<.01, Student's t test.

