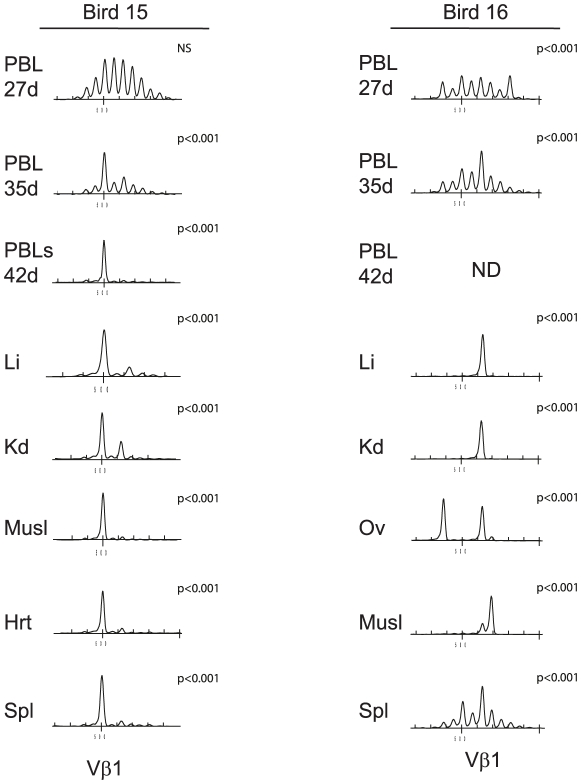
Figure 5. Spectratype analysis revealed that tumor clones can be identified in blood of MDV-infected birds.
TCRVβ1 CDR3 length distribution of tumor, spleen and peripheral blood lymphocyte (PBL) samples from bird 15 (left column) and bird 16 (right column). Tumor and spleen samples were taken at post-mortem (49 dpi with RB1B MDV) and samples of PBL at 27 and 35dpi. Dominant spectral peaks could be detected in the blood at 35 DPI which correspond to the tumor profiles which contained the expected dominant spectral peaks. The spectratype distributions of samples were compared with the TCRVβ1 or TCRVβ2 reference profiles for unsorted or CD4+ spleen cells obtained from uninfected birds by X2 analysis; statistical significance is indicated with each panel. NS = not significant (at p>0.05). Li, liver; Kd, Kidney; Ov, ovary; Spl, spleen; Musl, muscle; Hrt, heart; PBL, peripheral blood lymphocytes.

