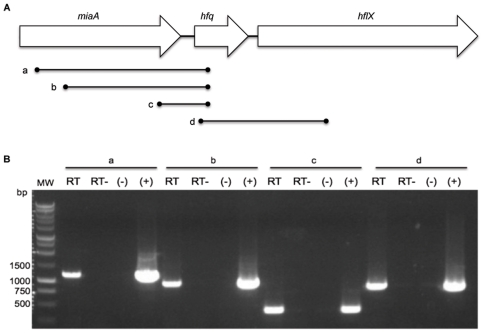
Figure 1. Transcription of the hfq locus.
(A) Genetic organization of the hfq locus. Lines a, b, c, and d indicate regions of the locus amplified by PCR as shown in panel B. (B) RT-PCR of the hfq locus. Lanes 1–4 corresponds to line a, lanes 5–8 to line b, lanes 9–12 to line c, and lanes 13–16 to line d. Within each set of 4 wells, PCR to amplify lines a–d was performed with RNA after RT, RNA without RT as a control, PCR without DNA template as a control, and PCR with genomic DNA from U112 as a positive control. MW denotes molecular weight marker (1 kb BenchTop marker, Promega).

