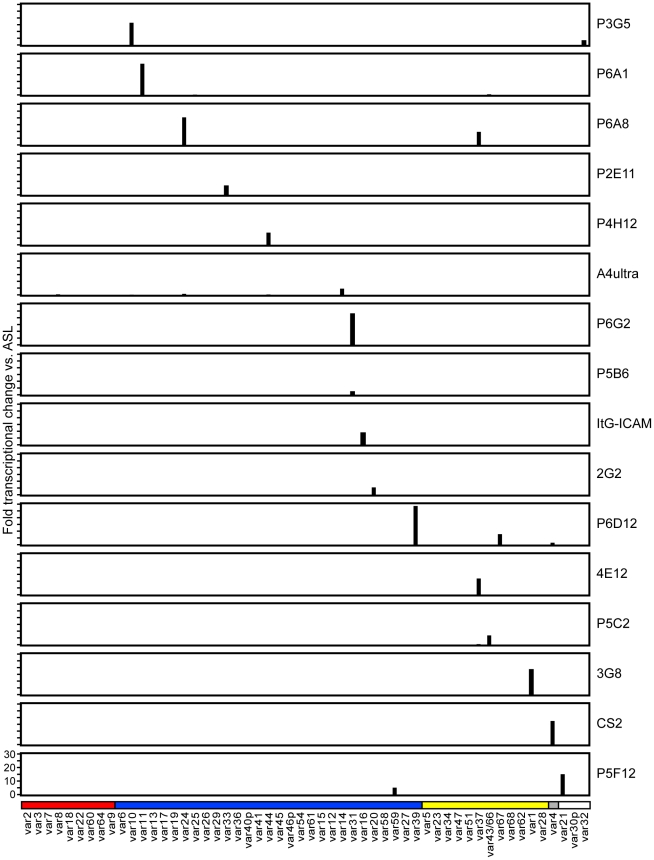
Figure 3. Analysis of var gene transcription in parasite lines at the time of infected erythrocyte binding assays.
RNA was harvested from ring stage parasites in the same cycle that infected erythrocyte binding assays were performed, and var expression profiling was performed by qRT-PCR. Most parasite lines expressed a single dominant var gene transcript, and some parasite lines had a secondary var transcript. Other var genes were expressed at negligible levels. Gene expression was normalized to the housekeeping control gene adenylosuccinate lyase (asl). The scale of the Y-axis is the same for all parasite lines. The A4 primer set is arranged along the x-axis by Ups category; UpsA (red), UpsB (blue), UpsC, (yellow), and UpsE (gray) groups, as well as three genes for which the Ups type has not been determined (white). The name of each parasite line is indicated at the right of its respective transcription profile.

