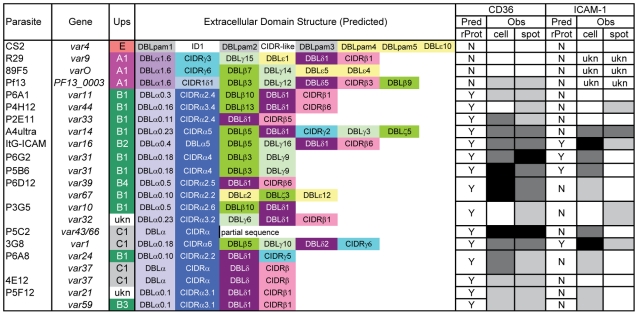
Figure 4. Schematic representation of var transcription in the parasite panel and summary binding to CD36 and ICAM-1 receptor proteins.
Parasite name, predominant var transcript(s) by qRT-PCR, Ups categorization, and predicted protein architecture are shown for parasite lines included in the panel, with the exception of the negative binding control line (2G2). Predicted binding of native PfEMP1 to CD36 and ICAM-1 receptor proteins based on previous analysis of CIDR::CD36 [46] and DBLβ::ICAM-1 interactions [44] are shown, along with observed binding to these receptor proteins in both cell and recombinant protein platforms. Low, moderate, and high binding levels are indicated in gray-scale: clear = <15 IE per 100 CHO cells, <80 IE per mm2; light gray = 16–50 IE per 100 CHO cells, 81–500 IE per mm2; dark gray = 51–100 IE per 100 CHO cells, 501–1000 IE per mm2; black = >101 IE per 100 CHO cells, >1000 IE per mm2. Ukn means the Ups type or binding behavior is unknown.

