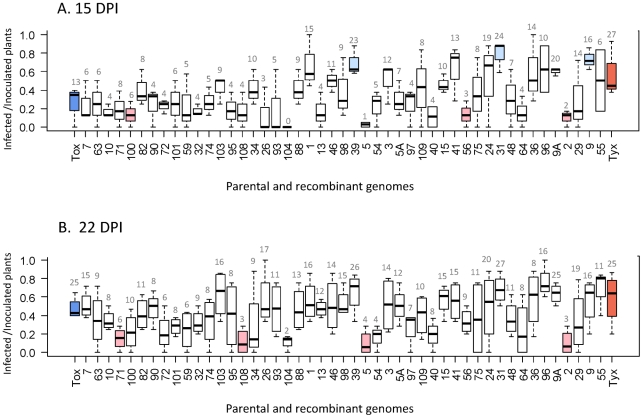
Figure 2. Infectivity of the 47 recombinants and their 2 parental genomes.
Infectivity was determined on plant samples collected at 15 (A) and 22 days (B) post-inoculation. Infectivity was defined as the proportion of infected plants (virus detected in systemic leaves) of the total number of virus-inoculated plants. Within the boxes, the horizontal line indicates the median value (50% quantile), the box itself delimits the 25% and 75% quantiles, and the dashed lines represent the normal range of the values. The numbers on the top line indicate the number of infected plants for each viral clone. The blue box at the left end corresponds to the parental genome Tox and the red box at the right end to the parental genome Tyx. The recombinant genomes are ordered from left to right by increasing nucleotide identity with Tyx genome. White boxes correspond to recombinants that are not significantly different from either parent, light red boxes to recombinants that are significantly less infectious than Tyx, and light blue boxes to recombinants that are significantly more infectious than Tox.

