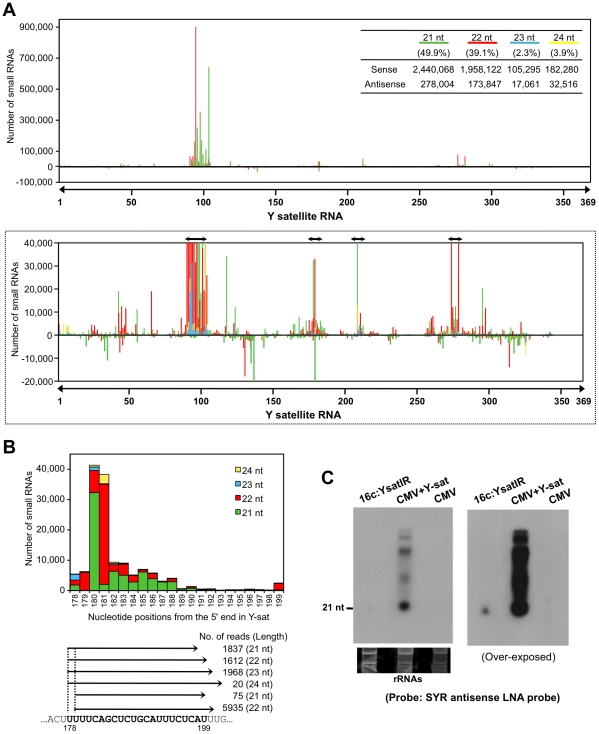
Figure 5. Small RNAs generated from SYR in Y-sat sequence.
A. Deep-sequencing analysis of the Y-sat small RNAs in N. benthamiana plants infected with CMV-Y and Y-sat. Location and frequency of Y-sat-derived small RNAs (21–24 nt) were mapped to the Y-sat sequence in either sense (above the x-axis) or antisense (below the x-axis) orientation. Data from 21-, 22-, 23-, and 24-nt small RNAs are color-coded in green (21 nt), red (22 nt), blue (23 nt) and yellow (24 nt). The table shows the small RNA reads and percentage of each size of the small RNA. The graph surrounded by broken lines shows an enlarged graph covering the number of small RNAs from –20,000 to 40,000 for better visibility of the small RNAs distribution. Double-headed arrows show the major hot spots where abundant siRNAs are generated from the Y-sat. B. Histogram of location, frequency and size distribution of small RNAs corresponding to the satellite yellow region (SYR) in Y-sat. Numbers on x-axis refer to location of SYR in the Y-sat sequence. The number of reads for the siRNAs homologous to SYR is given below the histogram. SYR is in bold face. C. Detection of siRNAs corresponding to SYR in 16c:YsatIR and Y-sat-infected plans in Northern blots. As a helper virus, CMV strain Y was used. LNA probes specific to SYR of Y-sat were used for hybridization. Ribosomal RNAs were used as a loading control. Left image was taken after 4 h exposure; right image is an overnight exposure of the same membrane.

