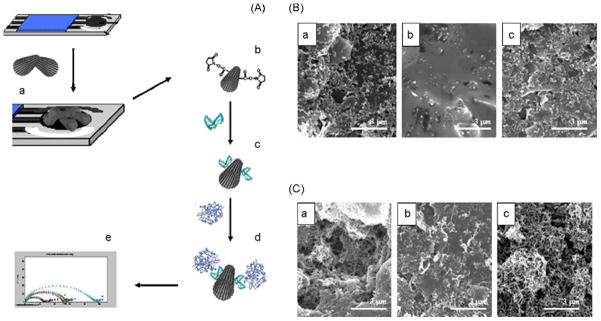
Figure 4.
(A) Schematic representation of the experimental procedure followed for the obtaining of the analytical signal: (a) multi-wall CNT modification of the SPCEs; (b) surface modification with covalent agents; (c) aptamer binding; (d) α-thrombin interaction; (e) EIS detection. (B) SEM images of the working surface area of bare SPCES after electrochemical pretreatment (a), after aptamer immobilization (b) and after its interaction with thrombin (c). (C) SEM images of the working surface area of MWCNT modified SPCEs after the same modifications detailed in (B). SEM resolution: 3 μm [180].

