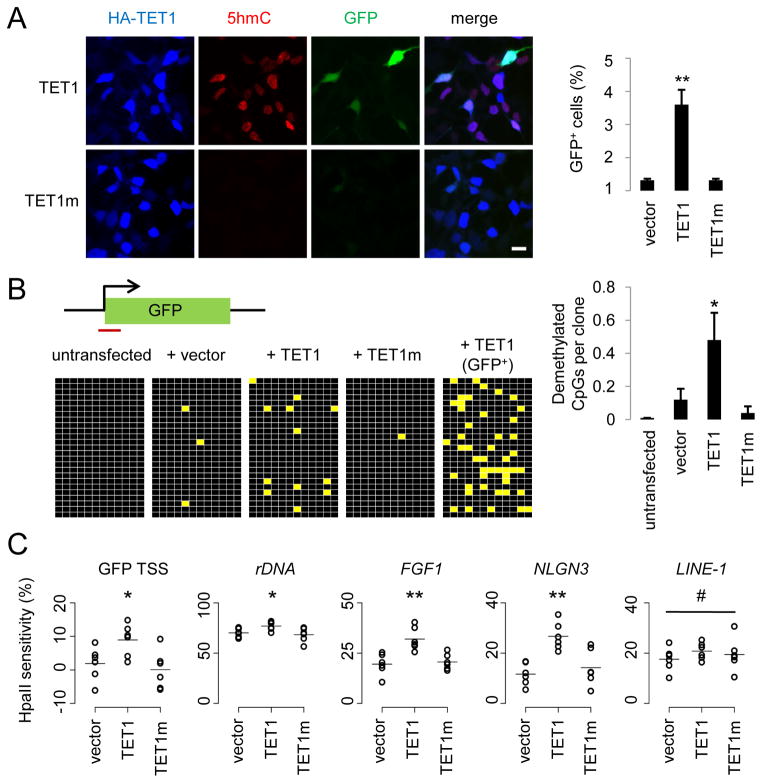
Figure 1. TET1 Catalyses 5mC Hydroxylation and Promotes Demethylation of Exogenous SssI-Methylated Reporter Plasmids and Endogenous Genomic Loci.
(A) Reactivation of methylation-silenced reporter plasmids by TET1. Shown on the left are sample images of immunostaining of HEK293 cells co-transfected with SssI-methylated GFP expression plasmids and expression constructs for TET1 or TET1m. Scale bar: 10 μm. Shown on the right is a summary of quantification of GFP+ cells as measured by FACS. Values represent mean ± SEM (n = 3; **: P < 0.01; Student’s t-test).
(B) Bisulfite sequencing analysis of reporter plasmids. Shown on the top is a schematic diagram of the region around GFP transcription start site (TSS) for bisulfite sequencing (indicated by the red line). Shown on the left are illustrations of methylation status of CpGs within the sequenced region. Black: methylated; yellow: unmethylated. Note the much higher level of demethylation in GFP+ sorted cells. Shown on the right is a summary of mean numbers of CpGs that are demethylated within each clone. Values represent mean ± SEM (n = 3; *: P < 0.05; Student’s t-test).
(C) Effects of TET1 and TET1m overexpression on the HpaII sensitivity of the GFP TSS region and several endogenous genomic loci in HEK293 cells. Open circles represent data from individual experiments and lines represent mean values (**: P < 0.01; *: P < 0.05; #: P > 0.1; Student’s t-test).

