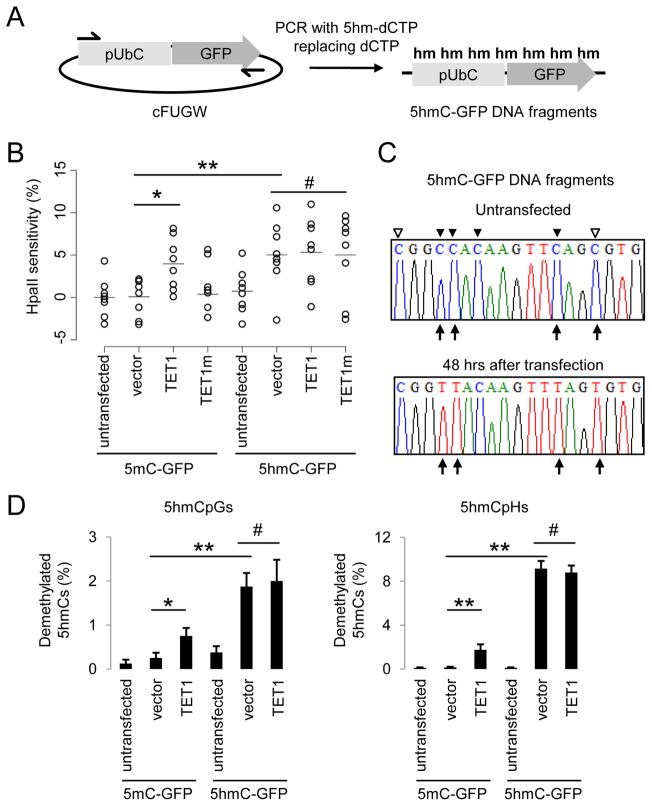
Figure 2. 5hmC-containing DNA Are Demethylated in HEK293 Cells.
(A) A schematic diagram of a PCR-based approach to generate 5mC-, or 5hmC-containing DNA fragments, that contain an Ubiquitin promoter (pUbC) followed by the GFP open reading frame.
(B) Summary of CpG methylation levels of GFP TSS regions under different conditions as quantified by the HpaII sensitivity. Open circles represent data from individual experiments and lines represent mean values (**: P < 0.01; *: P < 0.05; #: P > 0.1; Student’s t-test).
(C and D) Bisulfite sequencing analysis of 5mC-/5hmC-GFP DNA fragments under different conditions. Shown in (C) are sample traces from bisulfite sequencing of 5hmC-GFP DNA before or after transfection. Open and filled triangles indicate cytosines in CpG and CpH contexts, respectively. Arrows indicate demethylated 5hmCs. Shown in (D) are quantifications of demethylated CpGs (left) and CpHs (right) on 5mC-/5hmC-GFP DNA. Values represent mean ± SEM (n = 3; **: P < 0.01; *: P < 0.05; #: P > 0.1; Student’s t-test).

