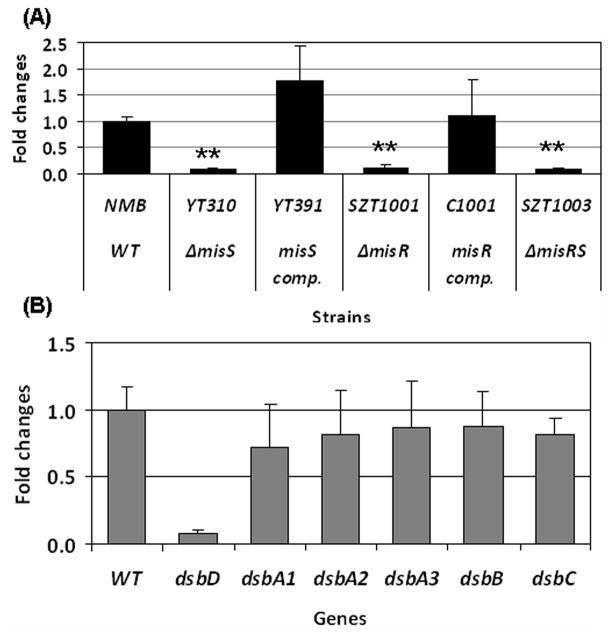
Figure 1.
(A) qRT-PCR determinations of relative transcriptional changes of dsbD in the misR/S mutants and complemented mutants. The relative changes in transcriptional level were calculated by the 2−ΔΔCt method (Livak & Schmittgen, 2001)with the wild type strain as the calibrator. The expression level of the wild type strain was set as 1 for normalizing the relative transcription levels of mutants and complemented mutants. (B) qRT-PCR analyses of all dsb genes comparing the wild type strain and the misS mutant. The expression of individual dsb genes in the wild type is set as 1. Each qRT-PCR was examined in triplicate and was repeated with at least four independent RNA preparations. The asterisks indicate statistically significant difference between the wild type strain and the mutant as determined by the Student’s t test with a 2-tailed distribution (P < 0.01).

