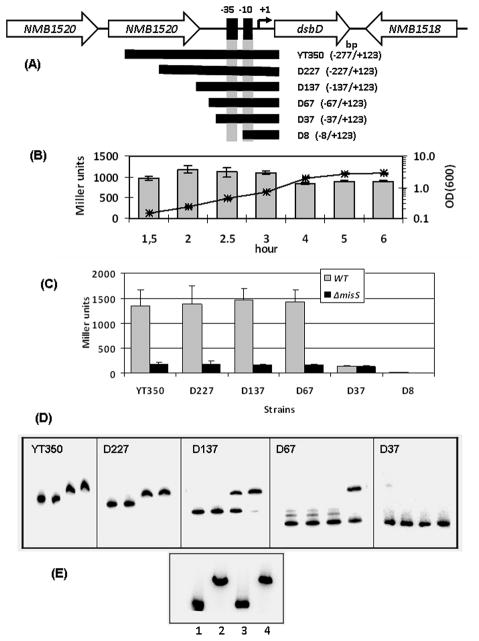
Figure 3.
(A) Schematic of the dsbD locus. The cloned region with respect to the transcriptional start site (+1) is shown in parentheses. The schematic is not to scale. (B) The expression of dsbD was not growth phase dependent. The β-galactosidase activity of strain YT350 were monitored over the growth curve, which is shown as a line graph with a semi-log scale on the secondary axis. Triplicate measurements were performed for each time points and the average of two independent experiments is shown. Error bars indicate the standard deviation. (C) Activities of various dsbD::lacZ transcriptional fusions. β-Galactosidase activities of strains grown to mid-log phase are expressed as mean values ± standard deviations of at least four independent assays done in triplicate measurements. (D) The interaction of MisR with the dsbD promoter examined by EMSA. The PCR products of various dsbD promoter fragments were 32P-labeled by T4 kinase, mixed with increasing amounts of MisR for 20 minutes at 30°C and then subjected to gel electrophoresis. In each panel, the left lane contains DNA probe only and the remaining lanes contain 10, 20 and 40 pmol of MisR, respectively. (D) Competition EMSA. The 32P-labeled D227 dsbD probe (lane 1) was mixed with 40 pmol of MisR alone (lane 2) or with either specific (1 μg, lane 3) or nonspecific DNA (1 μg, lane 4), and analyzed as described above.

