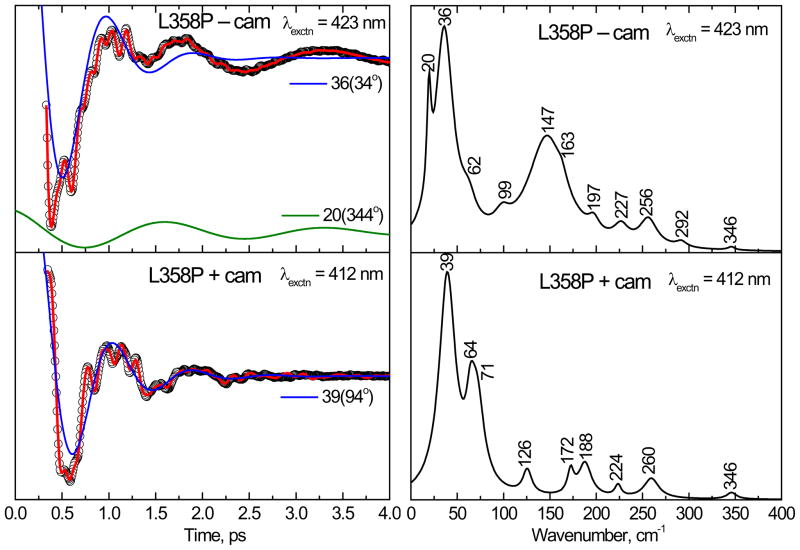
Figure 6.
The open band coherence spectra of the ferric form of the L358P mutant. The pump/probe excitation wavelengths are 423 nm and 412 nm for camphor-free and camphor-bound proteins, respectively. The left panels show the oscillatory components (circles) and the LPSVD fits (solid red lines). The LPSVD components corresponding to the dominant modes ~39 cm−1 and their phases are also shown. The right panel shows the corresponding power spectrum amplitudes. The modes near 36 and 147 cm−1 dominate the camphor-free form, whereas in the camphor-bound form, the modes near 147 cm−1 have disappeared and the modes at 39 cm−1 and ~ 64 cm−1 dominate the spectrum.

