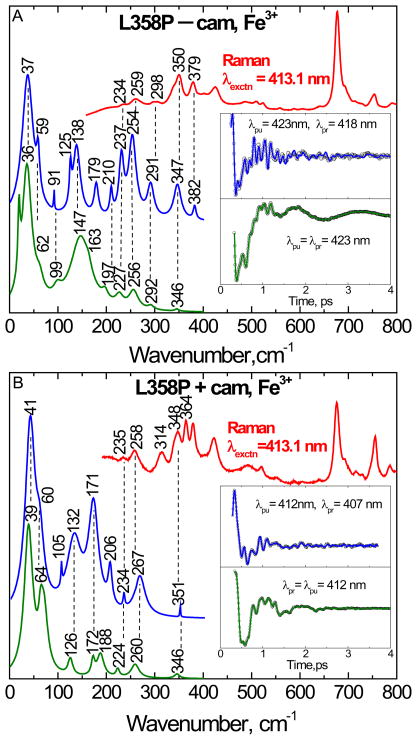
Figure 7.
The correlation between the Raman and coherence spectra for the camphor-free (A) and camphor-bound (B) form of ferric L358P. The Raman spectrum (red, upper curve) was measured with excitation at 413.1 nm, whereas the open band (green) and detuned (blue) coherence spectra were measured at a carrier wavelength of 423 nm for the camphor-free and 412 nm for the camphor-bound form. The detuned coherence data were collected with a 0.5 nm spectral window, detuned 5 nm to the blue of the carrier wavelength. The time domain oscillation data are shown in the inset as small circles and the LPSVD fits as the solid lines through the data. There is good correlation between the Raman and coherence spectral frequencies, with estimated errors of roughly ± 5 cm−1.

