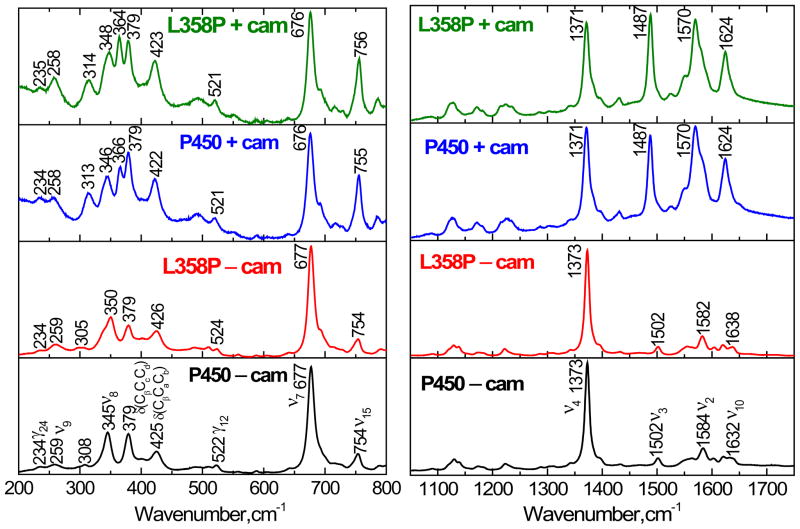
Figure 8.
Resonance Raman spectra of camphor-free and camphor-bound forms of ferric cytochrome P450cam and its L358P mutant. The spectra were obtained by exciting at 413.1 nm with a power of 6 mW. The left panel shows the low frequency and right panel shows the high frequency region. The descriptions of the modes are given in the text.

