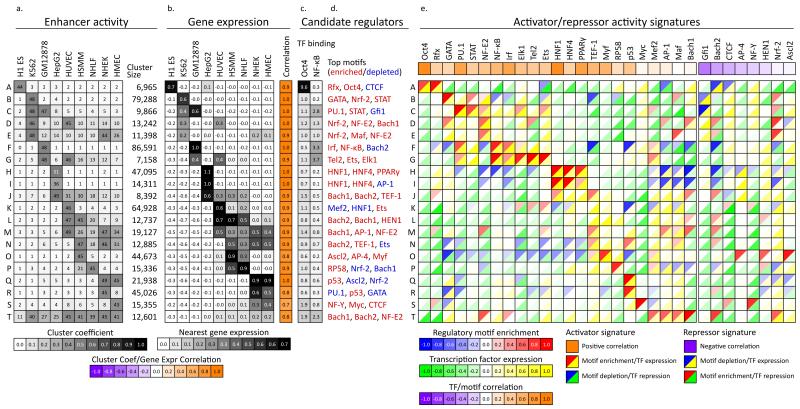
Figure 3. Correlations in activity patterns link enhancers to gene targets and upstream regulators.
a, Average enhancer activity across the cell types (columns) for each enhancer cluster (rows) defined in Figure 2b (labeled A-T) and number of 200bp windows in each cluster. b, Average mRNA expression of nearest gene across the cell types and correlation with enhancer activity profile from a. High correlations between enhancer activity and gene expression provide a means for linking enhancers to target genes. c, Enrichment for Oct4 binding in ES cells24 and NF-κB binding in lymphoblastoid cells14 for each cluster. d, Strongly enriched (red) or depleted (blue) motifs for each cluster, from a catalog of 323 consensus motifs. e, Predicted causal regulators for each cluster based on positive (activators) or negative (repressors) correlations between motif enrichment (top left triangles) and TF expression (bottom right triangles). For example, a red/yellow combination predicts Oct4 as a positive regulator of ES-specific enhancers, as its motif-based predicted targets are enriched (red upper triangle) for enhancers active in ES (cluster A), and the Oct4 gene is expressed specifically in ES cells, resulting in a positive TF expression correlation (yellow triangle). Overall correlations between motif and TF expression across all clusters denote predicted activators (positive correlation, orange) and repressors (negative correlation, purple).

